Best D3.js Resources to Buy in February 2026

D3.js in Action, Third Edition


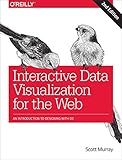
Interactive Data Visualization for the Web: An Introduction to Designing with D3



Learn D3.js: Create interactive data-driven visualizations for the web with the D3.js library



D3.js in Action: Data visualization with JavaScript


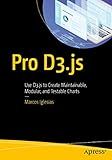
Pro D3.js: Use D3.js to Create Maintainable, Modular, and Testable Charts


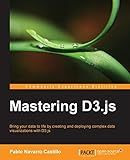
Mastering D3.js


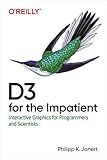
D3 for the Impatient: Interactive Graphics for Programmers and Scientists


To pass complex data in d3.js, you can create nested structures or objects within your data. This allows you to organize and access the data in a structured way. You can also use functions to process and manipulate the data before passing it to d3.js for visualization. In addition, you can use arrays or arrays of objects to store related data together. By properly structuring your data, you can make it easier to work with and manipulate in d3.js for creating visualizations.
How to pass unrelated data in d3.js?
In d3.js, you can pass unrelated data by using the .datum() method. This method allows you to bind a single piece of data to a specific DOM element without needing to join it with the existing data in your dataset.
Here is an example of how to pass unrelated data using the .datum() method:
// Create a new data object var newData = { name: "John", age: 30, city: "New York" };
// Select a specific DOM element and bind the new data to it d3.select("#elementId") .datum(newData) .text(function(d) { return d.name + " is " + d.age + " years old and lives in " + d.city; });
In this example, we are selecting a specific DOM element with the ID elementId and binding the newData object to it using the .datum() method. We then use the .text() method to display the data on the element.
By using the .datum() method, you can pass unrelated data to specific DOM elements in your d3.js visualizations without affecting the existing dataset.
How to pass filtered data in d3.js?
In D3.js, you can pass filtered data by using the filter() method to select only the data that meets certain criteria.
Here is an example of how to pass filtered data in D3.js:
// Set up the data var data = [5, 10, 15, 20, 25];
// Filter the data to only include values greater than 10 var filteredData = data.filter(function(d) { return d > 10; });
// Create a selection based on the filtered data var selection = d3.select("svg") .selectAll("circle") .data(filteredData) .enter() .append("circle") .attr("cx", function(d, i) { return i * 30 + 20; }) .attr("cy", 50) .attr("r", function(d) { return d; });
In the example above, we first set up an array data containing some values. We then use the filter() method to create a new array filteredData that only includes values greater than 10. We then use the filtered data to create a selection of circles in an SVG element.
This is just one way to pass filtered data in D3.js. Depending on your specific use case, there may be other methods or approaches you can take to filter and pass data in D3.js.
What is the best practice for passing data in d3.js?
In d3.js, the best practice for passing data is to use the data() method to bind data to elements in the selection. This method associates each piece of data with a corresponding element in the selection, allowing you to easily update, enter, and exit data as needed. Additionally, using the join() method can help manage the data binding process more efficiently by automatically handling the enter and exit selections. Overall, using these methods to pass data in d3.js ensures a clear and organized way to work with data in visualizations.
How to pass multiple datasets in d3.js?
In D3.js, you can pass multiple datasets by using the .data() method to bind data to elements in the DOM. You can pass an array of datasets as an argument to the .data() method, which will bind each dataset to the corresponding element in the selection.
Here's an example of how you can pass multiple datasets in D3.js:
// Define multiple datasets var data1 = [10, 20, 30, 40, 50]; var data2 = [5, 10, 15, 20, 25];
// Select the SVG element var svg = d3.select("svg");
// Bind data1 to circle elements svg.selectAll("circle") .data(data1) .enter() .append("circle") .attr("cx", function(d, i) { return i * 50 + 50; }) .attr("cy", function(d) { return 50; }) .attr("r", function(d) { return d; });
// Bind data2 to square elements svg.selectAll("rect") .data(data2) .enter() .append("rect") .attr("x", function(d, i) { return i * 50 + 50; }) .attr("y", function(d) { return 100; }) .attr("width", function(d) { return d; }) .attr("height", function(d) { return d; });
In this example, we have defined two datasets data1 and data2, and then we have bound these datasets to circle and rectangle elements in the SVG using the .data() method. We use the .enter() method to create new elements for each data point that does not have a corresponding element in the selection.
This is a simple example of how you can pass multiple datasets in D3.js. You can customize this code to suit your specific visualization requirements and data structures.
What is the enter-update-exit pattern in d3.js?
The enter-update-exit pattern in d3.js is a concept used to manage data-driven visualizations. It involves three key phases:
- Enter: This phase is used to create new elements for data that did not previously have a corresponding visualization element. Data elements that are newly added are represented as placeholders in the visualization.
- Update: In this phase, existing visualization elements are updated to reflect changes in the underlying data. This could involve changing attributes like size, color, position, etc.
- Exit: This phase deals with data elements that no longer have a corresponding visualization element. These elements are removed from the visualization.
By following the enter-update-exit pattern, developers can ensure that their visualization accurately reflects changes in the underlying data, and that elements are added or removed as needed to maintain a consistent and accurate representation of the data.
How to pass audio data in d3.js?
In d3.js, you can pass audio data by using the HTML5 Web Audio API. Here is a step-by-step guide on how to pass audio data in d3.js:
- Load the audio file: You can load an audio file using the HTML5 Audio element in your HTML file. For example, you can add the following code to load an audio file named "audio.mp3":
- Access the audio data: You can access the audio data using the Web Audio API. You can create an audio context and load the audio data using the following JavaScript code:
var audioContext = new(window.AudioContext || window.webkitAudioContext); var audioElement = document.getElementById('audio'); var source = audioContext.createMediaElementSource(audioElement);
- Create a visualization: You can use d3.js to create a visualization of the audio data. For example, you can create a waveform visualization by analyzing the audio data using the Web Audio API's AnalyserNode. You can add the following code to create a waveform visualization:
var analyser = audioContext.createAnalyser(); source.connect(analyser); analyser.connect(audioContext.destination);
var svg = d3.select('body').append('svg') .attr('width', window.innerWidth) .attr('height', window.innerHeight);
var data = new Uint8Array(analyser.frequencyBinCount); var colors = d3.scaleSequential(d3.interpolateRainbow).domain([0, data.length]);
function update() { analyser.getByteFrequencyData(data);
svg.selectAll('rect') .data(data) .enter() .append('rect') .attr('x', function(d, i) { return i * (window.innerWidth / data.length); }) .attr('y', function(d) { return window.innerHeight - d; }) .attr('width', window.innerWidth / data.length) .attr('height', function(d) { return d; }) .attr('fill', function(d, i) { return colors(i); });
requestAnimationFrame(update); }
update();
- Start the visualization: You can start the visualization by playing the audio file using the following JavaScript code:
audioElement.play();
By following these steps, you can pass audio data in d3.js and create visualizations based on the audio data.
